
Home » Economics
Category Archives: Economics
Brinkmanship Provided Opportunities in T-Bills
Last week, just prior to the temporary resolution of the debt ceiling issue, I wrote up this article for Seeking Alpha. It covered two topics. The first was about a couple of articles discussing price action in the Bill markets. The second and more interesting part illustrated how investor preferences were creating arbitrage opportunities for T-Bill investors. Let me know what you think.
To (QE-)Infinity and Beyond
Please check out my new article at Seeking Alpha. It discusses Fed QE exit strategies and what could go right or wrong.
We Interrupt Our Regularly Scheduled Programming
I was doing my morning reading prior to the release of NFP, and came across this article from Bloomberg. The article is about Takeshi Fujimaki. In addition to being a “former adviser” to George Soros, he won a seat in Japan’s upper house of parliament last month. He calls the JGB market a bubble which has been said before but the very last paragraph blew me away:
“It’s impossible to avoid a default at this point, but what’s important is to create a system to avoid the same mistake and that’s where I can contribute as a politician,” Fujimaki said.
By the way, I found the above paragraph even more staggering than the one before it. In the paragraph before, Fujimaki said that “The yen’s fundamentals suggest to me it should be around 180 to 200 per dollar.”
Wow. We have all read (and re-read) Kyle Bass on how Japan is about to implode (I’ll add that I am a fan of Bass). There is a massive difference, however, between a hedge fund manager suggesting JGB’s collapse and an elected politician (even if ex-hedge fund) comes out and tells the world that a JGB default is inevitable.
A Fed Primer: Mechanics of QE, Money Multipliers and Inflation
“The good God is in the detail.” – Flaubert
This piece began as an effort to understand Fed money creation and to be able to effectively answer why the Fed can’t simply hand over its US government bond portfolio to Treasury. My fundamental assumption was that it was necessary and useful to understand the mechanics. Rather than “the devil being in the details,” I found that quote from Flaubert more appropriate. I find the idea fitting that by appropriately understanding the details, one can create an appreciation of the whole. This piece covers the necessary working details of the Fed and money. This piece will be the first in various pieces that will use the work herein to address the Fed, market activity and intelligent speculation, including why we can’t eliminate our debt by swapping Fed holdings with Treasury liabilities.
Balance Sheets and T-Accounts
To understand how money works, consider a closed system with one bank, the Fed and the Treasury (UST). This is sufficient to both describe and understand what happens on the Fed’s balance sheet as the one bank represents the banking system in aggregate.
In the beginning, there is no Fed balance sheet, and no new UST issuance. Anything already issued exists as an asset somewhere else. The bank starts with $100 in deposits which shows up as a debit or liability because the owner of the account can come anytime to claim the $100. As the bank has not yet done anything with the deposit, the $100 is an asset on the balance sheet of the bank. It would, of course, look to put this money to work via the purchase of an asset, e.g., making a loan or buying UST notes. Here is what it looks like. In aggregate, there is no money growth and this can be seen as the Net economy wide is in balance: credits = debits.
Time 0 (Pre-Fed balance sheet operations):
|
Bank |
Fed |
UST |
Net (Economy) |
||||
|
Cr |
Db |
Cr |
Db |
Cr |
Db |
Cr |
Db |
| $100Cash | $100Deposit | $100 | $100 | ||||
Next, the UST needs to issue new debt, conveniently in the amount of $100 and sells that note to the bank. The $100 cash is transferred to the UST from the bank. The UST has created a liability to the Bank, so the $100 Note shows up as a debit for the UST and a credit for the Bank. While there are more entries for the individual entities, the net balance for the economy is still zero since the sum of credits and debits are equal.
Time 1 (UST issues debt):
|
Bank |
Fed |
UST |
Net (Economy) |
||||
|
Cr |
Db |
Cr |
Db |
Cr |
Db |
Cr |
Db |
| $100Note | $100Deposit | $100Cash | $100Note | $100 | $100 | ||
| $100 | $100 | ||||||
Once the Fed decides to purchase securities for its own account, it creates the money. Everything must still be in balance. The Fed simply arranges for a credit balance matching the price of the note to show up in the account that the Bank has with the Fed. That credit balance can then be used as the Bank sees fit. At the same time, currency is a liability of the Fed and shows up as a debit in the Fed’s balance sheet. The purchase of the note shows up on the Fed’s books as $100 note.
Time 2 (Fed purchase):
|
Bank |
Fed |
UST |
Net (Economy) |
||||
|
Cr |
Db |
Cr |
Db |
Cr |
Db |
Cr |
Db |
| $100
Cash (from Fed) |
$100
Deposit |
$100
Note |
$100 Currency | $100
Cash |
$100
Note |
$100 | $100 |
| $100 | $100 | ||||||
| $100 | $100 | ||||||
The economy wide balance sheet still balances. However, it is now larger, at a size of $300. There is an extra $100 of currency in the system. The Fed created that money out of thin air when it credited the account for the Bank in exchange for the $100 worth of notes. While the numbers are different, this is the situation as it is now in the US economy: the Fed has created money.
The Money Multiplier
The money multiplier, as it works with banks and reserves, is well described in many textbooks. Briefly described, a bank need only post as reserve a fraction of the amount of deposits or liabilities that it obtains. The current ratio requirement is 10%. That is, a bank must hold as reserve $10 for every $100 of deposit liabilities (this is not quite right, see FRB here). It then may purchase assets with the other $90. This then occurs at the next bank that takes in the $90 as a loan and must hold $9 in reserve. $81 is now available at the second bank for investment. In the extreme, the money multiplier can create 1/(reserve ratio) in total money. In this case, that would be $100/10% = $1000. Keep in mind that there is a matching $1000 of liabilities. Also keep in mind that this is the most that can be produced; frictions will keep the ratio lower.
This is not the only source of money and leverage. Collateral can also be used in the same way was the multiplier. Consider an entity that buys a debt security. They can use the note as collateral to fund the asset purchase. The lender will require a haircut. That is, lenders require the loan to be over-collateralized loosely based on the liquidity and volatility of the asset. For a US Treasury note, that might be 95% of the value of the note. For a corporate bond or a stock, it might be only 50%. The rest needs to be in actual capital. It also turns out that the lender can then take the collateral and re-lend it out again to fund their loan to the original entity. They, too, will get a haircut on their collateral. And so on. This too will lead to a multiplier, albeit a lower one based on the aggregate haircut levels across collateral types. This recycling of collateral is called rehypothecation and is what is referred to as the “shadow banking sector” because it is not regulated by the Fed in the same was as deposits are.
The above paragraph describes this activity as lending but the lending is done via the repo market. That is, the transactions are buy-sell agreements rather than collateralized loans. That means that the lender actually does own the collateral for the period of the loan. That is what enables the rehypothecation. As a notable aside, trouble can occur if a party defaults on its loan somewhere in the chain. This is most especially true for collateral that requires a large haircut, such as stocks or high yield bonds. If a bank somewhere done the chain defaults, there becomes a problem as to how to disentangle multiple claims of the same collateral. A counterparty might have a loan of $200 against $400 of collateral. If its lender goes under, then the counterparty sustains a loss if the collateral is unable to be obtained or even if it simply takes too long to be useful. This is one of the biggest issues that came about when Lehman declared bankruptcy. See this IMF report for more information.
Inflation and Money
Milton Friedman said that “substantial inflation is always and everywhere a monetary phenomenon.” Yet there is no substantial inflation despite a large increase in the monetary base. As usual, there is something more than the sound bite. That something is the equation MV=PQ. The equation indicates that money supply (M) multiplied by the velocity (V) of money is equal to prices (P) multiplied by output (Q). A reasonable intuitive, working definition of velocity is that it represents how efficiently money is being used in the economy. Higher velocity means that each dollar is being used many times over – much like a gear increases force. Incidentally, we measure the quantity PQ as real GDP. You can find a picture of Friedman’s license plate, MV=PQ, and a similar explanation here. There is also more about Friedman’s quote here.
Friedman viewed V and Q as relatively stable. That is why he simplified his quote as M being directly proportional to P. This also makes good sense from the perspective of supply and demand. We price everything in dollars. If the amount of dollars increases relative to the amount of goods, it stands to reason that prices will go up since there are more dollars. In math terms, the price of a good could be looked at as price = (# of dollars)/(supply of good). Consider a micro-economy with money supply $10 and 100 widgets. The price of widgets should then be $10/100 or 10c. This is, of course, not a real example but just an illustration of how the dynamic works. This is one reason why the word “substantial” is so important because in the short run prices are impacted by many factors.
Nevertheless, the monetary base has expanded quite dramatically.
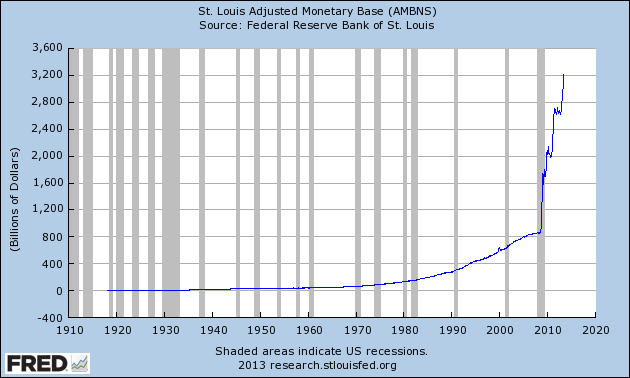
To put this in perspective, consider that the money supply has grown 370% since August 2008, just under 5 years ago. That kind of growth took nearly twenty years in the prior period (Oct 1989 to Aug 2008) and that prior period was viewed at the time to be a very high money growth period. But look at the velocity of money:
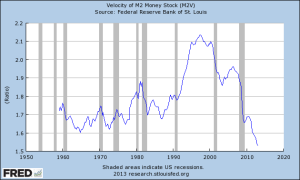
The decline is unprecedented in modern US economic history. Consider the following, as well:
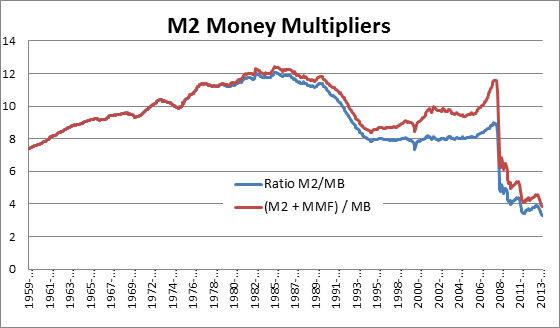
The chart shows the ratio of M2 to the monetary base (MB). The blue line is simply M2 divided by the St. Louis Adjusted Monetary Base. All data here are from FRED. Deposits became less important since the 1980’s and M3 is discontinued, therefore the red line adds institutional money market fund assets to M2 before dividing by MB. It appears to provide a more continuously sensible data series. Regardless which series one prefers, it is clear that the money multiplier is broken, at least as it relates to M2 as given. M2 is not all types of money. It includes currency, checking deposits, savings deposits, retail money market funds and small time deposits. An intuitive understanding of the money multiplier, like velocity, is how efficiently the monetary base is integrated into what people actually use to buy things. The Office of Debt Management (ODM) has termed this “effective money” and that term is a good fit as a concept. A measurement is necessary in order to use the concept. At one time, M2 was considered a reasonable assessment of effective money. That is no longer the case. In this report, ODM calculates effective money as M2 + shadow money.
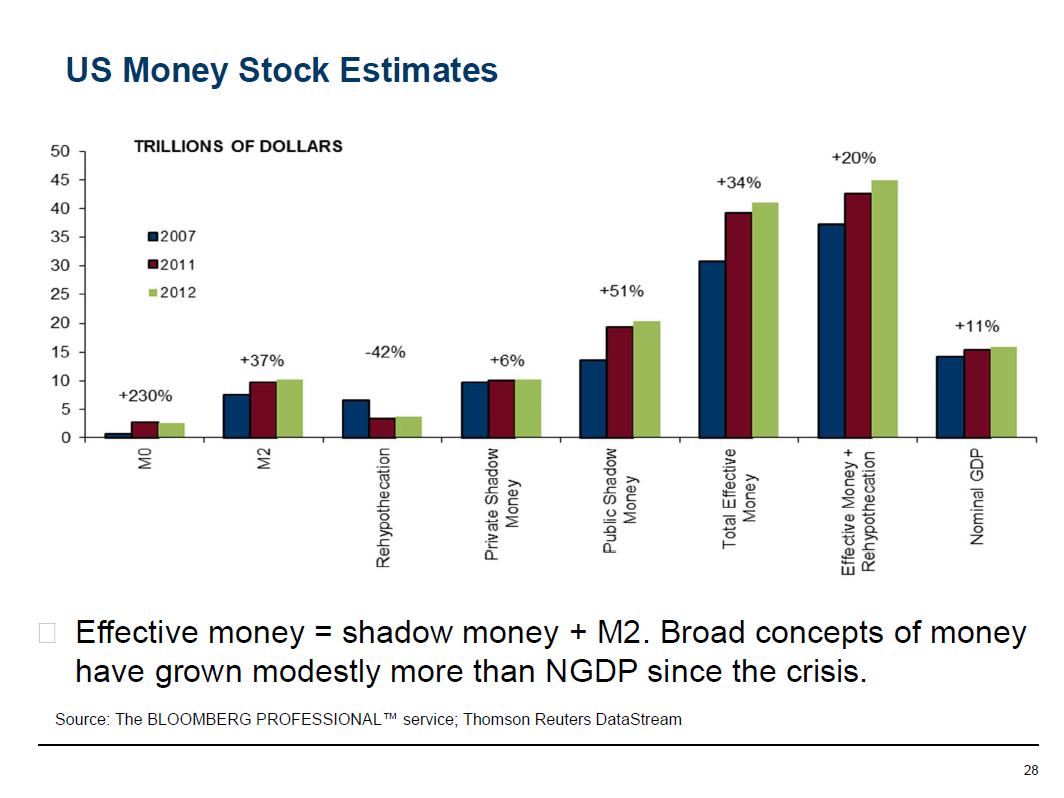
This is slide 78 of the fiscal 2013 Q2 report referenced above. It is clear that no matter which measure of money that one looks at the multiplier is broken. That is, additional money has not been multiplied at all but instead been “downshifted.” This slide shows Total Effective Money has grown 34% since 2007; effective money + rehypothecation (a broader measure that this author believes is a better measure of effective money, the concept) has grown merely 20%. This is not the type of substantial money growth that Friedman had in mind when anticipating inflation.
Either the transmission mechanism is not working properly or money is being withheld from the economy or some combination of both. There are two mechanisms for money multipliers as discussed above: fractional reserve banking and collateralized banking (referred to as shadow banking). The ODM data above shows collateralized banking has collapsed by nearly half, down 42%. This is hardly surprising as private sector collateral has not grown (up 6%) and the Fed via QE has purchased and thereby withheld large portions of the public sector collateral that has grown (up 51%). In addition, the money multiplier graph above shows that the traditional fractional reserve banking relationship has also broken.
Referring to the earlier section on money creation above, the Fed has created money. That money is created as bank reserves. That is, they are on deposit with the Fed. It is an asset of the bank and the bank has the choice to exchange the cash (reserves) for another asset, such as a loan. If it does, then it needs to hold a fraction of the loan on reserve at the Fed. This is the source of the term fractional reserve banking. Reserves do not disappear; reserves are constant across the banking system but not for a particular bank. For a treatment as to why that is the case, read “Why Are Banks Holding So Many Excess Reserves” from the NY FRB. Reserves plus currency are the monetary base.
While the reserves do not disappear, they can be either required reserves backing “working” assets or excess reserves simply on deposit at the Fed. The required reserves represent money that has been multiplied. The excess reserves do not do any of the work of the economy. This chart re-draws the M2 money multiplier, but it reduces the monetary base by banks excess reserves:
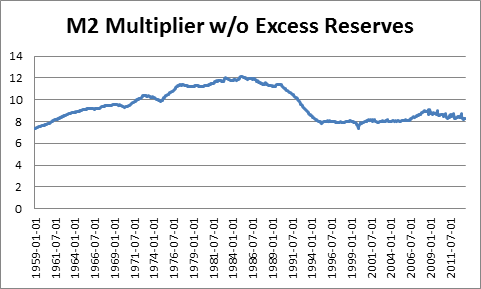
Clearly, this looks far more normal. However, looking normal should not be confused with being correct. Nevertheless, the theory (that some large proportion of money is not being multiplied) and the data match. Regardless of the reason why money is being withheld as excess reserves, it is clear that so long as monetary base creation by the Fed is sitting as excess reserve balances, M2 can only grow linearly with additional money creation rather than geometrically.
Conclusion
This article has addressed monetary base creation, theoretical money multipliers and empirical money supply. At the very least, it is clear that for all of Bernanke’s effort with his helicopter, he has thus far been unable to create substantial effective money creation. Without that substantial effective money creation, money driven inflation cannot occur (a shortage of goods could still produce inflation). Until the transmission mechanism for the money multipliers kick in again, inflation will not be a problem.